You're here: Noquemanon Home Page :: Course Info :: Map Index
www.Noquemanon.com
:: info@noquemanon.com
:: 1.866.370.RACE
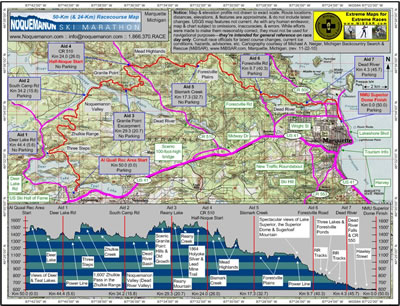
Noquemanon 50-km (and 24-km) Map Index
|
Racecourse Map & Elevation Profile |
Racecourse Beta |
||||||||||||||||||||||||||||||||||||||||
|
|||||||||||||||||||||||||||||||||||||||||
|
|
|
Section Maps & Elevation Profiles |
Section Beta |
|

|
||
|
|
Notice:
The maps and elevation profile charts are not drawn to exact scale. Route locations, distances, elevations, features, statistics, and descriptions are approximate, and do not include the latest changes or reroutes. USGS base map features are not current. As with any human endeavor, this map and chart are subject to omissions, inaccuracies, and errors. While efforts were made to make them reasonably correct, they must not be used for navigational purposes—they are intended for general reference on race day only. Consult race officials for the latest course changes and reroutes as well as current ice conditions, hazards, advisories, etc.
|
Web page design, hosting,
& cartography courtesy of Michael A. Neiger of Michigan Backcountry
Search and Rescue (MiBSAR), www.MiBSAR.com,
in Marquette, Michigan.
|
 |
Michael Neiger welcomes your comments and suggestions on how to improve the maps, charts, and information on this Web page at mneiger@hotmail.com. |
| You're here: Noquemanon Home Page :: Course Info :: Map Index |
Copyright © 2010 by Noquemanon
|
